Sampling and Creating Training Data
Chapter 7.2: ML Workflows – Sampling and training data
7.2 Sampling and creating training data
-
[E] If you have 6 shirts and 4 pairs of pants, how many ways are there to choose 2 shirts and 1 pair of pants?
6 * 4 = 24 (1-shirt, 1-pants pairs)
- For each of the 6 shirts, there are 5 other shirts I can choose to go with:
5 * 6 = 30 shirt pairings
30 * 4 = 120 (2-shirt, 1-pants pairs)
- [M] What is the difference between sampling with vs. without replacement? Name an example of when you would use one rather than the other?
- Sampling with replacement: Each time a sample is drawn and observed from a finite population, its returned to that population before the next sample is drawn
- Without replacement: A sample is randomly drawn from a finite population only once. It’s not placed back in the sample space
Name an example of when you would use one rather than the other?
- With replacement: Where IID data is desired. Bootstrapping
- Without replacement: Sampling mini-batches (converges faster, than with replacement)
Ref:
- [M] Explain Markov chain Monte Carlo sampling.
-
For most probabilistic models, exact inference is intractable so we result to approximation
“The exact infrence is typically a sum of a discrete distribution or integral of a continuous distribution of many variables”
Monte Carlo
- A solution is to draw independent samples from the probability distribution then repeat as many times as needed for approximation (Monte Carlo sampling)
- Estimation of the sum or integral quantity can then be the mean or variance of the drawn samples.
- The issue with Monte Carlo sampling though is:
- Assumes each random sample drawn from the target distribution is independent and can be independently drawn
- Makes it intractable for Bayesian or graphical probabilistic models
- Suffers in high dimensions. Volume of sample space increases exponentially with no. of parameters(dimensions) (Curse of dimensionality)
- Assumes each random sample drawn from the target distribution is independent and can be independently drawn
Markov chain:
- A markov chain is a sequence (chain) of possible events where the probability of each event depends only on the value attained on the most recent event
Markov Chain Monte Carlo (MCMC)
- MCMC is Monte Carlo integration using Markov Chains. Monte Carlo draws samples from a distribution by running a Markov chain
samples are drawn from the probability distribution by constructing a Markov Chain, where the next sample that is drawn from the probability distribution is dependent upon the last sample that was drawn.
The idea is that the chain will find equilibrium on the desired quantity being inferred.
- Specifically, MCMC is used for performing inference for probability distributions where independent samples cannot be (easily) drawn from the distribution
Ref:
https://machinelearningmastery.com/markov-chain-monte-carlo-for-probability/
-
-
[M] If you need to sample from high-dimensional data, which sampling method would you choose?
[Unsure]. A probabilisitc sampling method. Random sampling based techniques could work., eg Monte Carlo
Sampling methods:
https://www.analyticsvidhya.com/blog/2019/09/data-scientists-guide-8-types-of-sampling-techniques/
Update:
-
I think a good population sample would be where we get samples with different features. So we can use stratified sampling to select data based on feature differences and have all features represented in the population sample
-
-
[H] Suppose we have a classification task with many classes. An example is when you have to predict the next word in a sentence – the next word can be one of many, many possible words. If we have to calculate the probabilities for all classes, it’ll be prohibitively expensive. Instead, we can calculate the probabilities for a small set of candidate classes. This method is called candidate sampling. Name and explain some of the candidate sampling algorithms.
Hint: check out this great article on candidate sampling by the TensorFlow team.
- Yeah, check that great article :)
In brief:
- Sampled softmax
- Rather than compute logits for all classes $y \in L$, a small subset of the classes is sampled according to some sampling function $S_i = Q(y | x)$.
- Each class $y \in L$ is included independently in samples $S_i$
- $C_i = S_i \cup {t_i}$. $C_i$ is a union of the sampled set $S_i$ and the target class $t_i$ for $x_i$
- The training task is now to figure out which label in $C_i$ is the target label. This is done using Bayes theorem $P(t_i = y | C_i, x)$
- Noise Contrastive Estimation (NCE)
- Each training example has a context and a multiset of target classes $(x_i, T_i)$
- If the set has no duplicates, the probability of the a class given the context is $P(y | x) := E(P(T(y) | x)$
- Aim is to train a function $F(x, y)$ to estimate the log probability of the class given the context $F(x, y) = \log ( P(y | x))$
- For each example $(x_i, T_i)$, a multiset of sampled classes $S_i$ is picked
- $C_i = T_i + S_i$ (Sum). The training task is then to distinguish the true candidates from the sampled ones
- $F(x, y) $ is trained to approximate $\log P(y | x)$
- Negative sampling
- Simplified version of NCE
- Unlike NCE, $\log Q(y | x)$ is not subtracted from $\log P( y | x)$ during training, thus $F(x, y)$ is trained to approximate $\log E(y | x ) - \log Q(y | x)$
- Sampled Logistic
variant on Noise Contrastive Estimation where we discard without replacement all sampled classes that happen to also be target classes
- It required $T_i$ to be a set as opposed to a multiset, though $S_i$ can be a multiset
-
Suppose you want to build a model to classify whether a Reddit comment violates the website’s rule. You have 10 million unlabeled comments from 10K users over the last 24 months and you want to label 100K of them
Hint: This article on different sampling methods and their use cases might help.
- [M] How would you sample 100K comments to label?
- The histogram of the sample set should be the same as the histogram of the population
(1)
- The simplest way is to take a sub-sample randomly with uniform distribution and check it’s significance
If it’s not significant, we’ll take another sample and repeat the procedure until we get a good significance level.
https://www.kdnuggets.com/2019/05/sample-huge-dataset-machine-learning.html
- Here we can randomly sample 100K/ (no of users) comments from each user
- But simple random sampling may fail to capture enough negative/minority samples
(2) Clustered sampling
- Cluster the data and select samples to be labelled from each cluster
(3) Stratified Sampling
- Divide the population into subgroups based on different traits, like user, subredit, e.t.c then select samples from each subgroup
- If we are not sure which properties to use, then use clustered sampling. Clustered is just more expensive on computation
- [M] Suppose you get back 100K labeled comments from 20 annotators and you want to look at some labels to estimate the quality of the labels. How many labels would you look at? How would you sample them?
- A few labelles from each annotator. The quality of labels will be determined by the annotator. So cluster the samples based on the annotator then randomly sample from each cluster
- [M] How would you sample 100K comments to label?
-
[M] Suppose you work for a news site that historically has translated only 1% of all its articles. Your coworker argues that we should translate more articles into Chinese because translations help with the readership. On average, your translated articles have twice as many views as your non-translated articles. What might be wrong with this argument?
Hint: think about selection bias.
Context:
Selection bias:
occurs when individuals or groups in a study differ systematically from the population of interest leading to a systematic error in an association or outcome.
-
The assumption is that:
Either: the more translated views are from Chinese translations thus translating more articles to Chinese will bring more views
Or: Chinese has a large reader audince, so if there are no Chinese articles yet, having them will enboard more views
- For both assumptions, it’s important to verify which translated articles generate most views and where (location) those views mostly are
- This will help identify if Chinese translations are likely to contribute more views
-
- [M] How to determine whether two sets of samples (e.g. train and test splits) come from the same distribution?
- Measure the difference between the distributions of the two sets
From SE:
“””
The Kolmogorov-Smirnov test is the most common way to do this, but there are also some other options.
The tests are based on the empirical cumulative distribution functions. The basic procedure is:
- Choose a way to measure the distance between the ECDFs. Since ECDFs are functions, the obvious candidates are the $L^p$ norms, which measure distance in function spaces. This distance is our test statistic. Kolmogorov-Smirnov test uses $L^\infty$ norm
- Figure out the distribution of the test statistic under the null hypothesis that the samples come from the same distribution
- Choose a threshold, $α$, for your hypothesis
“””
A emperical way to determine would be:
- Make all labels of the train set positive, and all labels of the test set negative
- Train on the train set and get the test accuracy of the test set
- The lower the test accuracy, the lower the difference in the two distributions
Refs:
-
[H] How do you know you’ve collected enough samples to train your ML model?
Some ways to determine this:
- Rule of 10
- The no. of data points should be 10x the number of model parameters
- With linear models like logistic regression, no. of parameters = no. of input features
- With neural nets though, this rule is just a lower bound as relationship between parameters and the data is no longer linear
- Approaches to similar problems
- How much data was needed by approaches that addressed a similar problem?
- Model complexity or problem complexity
- The training data required grows with model/problem complexity
-
Accuracy vs training data size plot (For classification)
Determine the exact form of the learning curve for your domain, and then, simply find the corresponding point on the plot for your desired classification accuracy
- Other heuristics:
- Considering the predictor variables, ratio of positive samples to sample size/ data imbalance
- Each class should have x independent samples, eg ~1000 per class for CV classification
Refs:
https://towardsdatascience.com/how-do-you-know-you-have-enough-training-data-ad9b1fd679ee
https://malay-haldar.medium.com/how-much-training-data-do-you-need-da8ec091e956
https://machinelearningmastery.com/much-training-data-required-machine-learning/
- Rule of 10
-
[M] How to determine outliers in your data samples? What to do with them?
Identifying outliers
- Sort the data
- Look for unusually high or low value differences at the top or bottom of the sort
- Graph the data
- Plotting the data will show deviating points
- Boxplots, histograms, scatterplots
- Visual methods help show which points need further investigation
- Z-score for normally distributed data
- Outlier points have high z-scores
- Interquartile range (IQR)
- IQR is the middle 50% of the dataset
- A point can be said to be an outlier if “it is over 1.5 times the IQR below the first quartile or 1.5 times the IQR above the third quartile”
- Minor or major will be the unusualness of the outlier relative to the distribution of other values
- Percentiles are not dependant on a certain distribution, which makes this method robust to finding outliers
Ref:
https://statisticsbyjim.com/basics/outliers/
What to do with them
- Remove them
- Be able attribute a specific cause for doing this
- If it’s not a part of the population e.g due to sampling error
- Correct them
- In case of wrong recording of measurements, and it’s easy to identify what the intended value was
- If unsure, remove it
- [Also] Reconsider the underlying distribution
- Maybe the assumed distribution on the data is wrong
- Sort the data
- Sample duplication
- [M] When should you remove duplicate training samples? When shouldn’t you?
- It depends on whether the dataset with duplicates is repsentative of the data that will be seen in the real world
- Duplicates can arise from non-random sampling. In that case, they’ll bias the model. Remove them
- If the train and test set come from the same distribution, then a duplicate sample from the train set will still be repeated in the test set. In that case keep the duplicates as the model adds weight to the duplicate samples
-
For example, if using a cars dataset, very common cars will be repeated. This is representative of what the model will encounter in the real-word, so the duplicates shoudn’t be removed.
Ref:
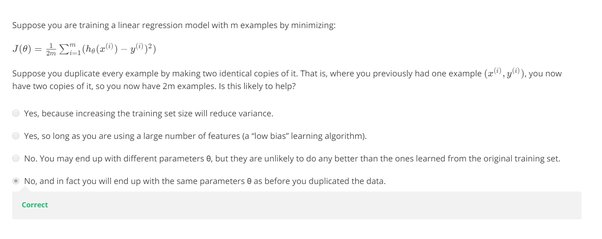
- [M] What happens if we accidentally duplicate every data point in your train set or in your test set?
- If an element is duplicated in the training data, its weight is doubled. The classifier assigns higher importance in predicting it correctly compared to the other elements. If all points are duplicated, then all points have their significance equally increased. This won’t have any effect on the parameters $\theta$ compared to a non-duplicate dataset
- Duplicates in the test set have no importance — the model is being tested on the same sample and will give the same answer.
- Not unless they are an equal no. of duplicates (but not for every data point) in the train and test set, then the cumulative test error of the duplicates is representative of the model’s overall performance since rarer samples occur less often
Refs:
https://stats.stackexchange.com/questions/392216/removing-duplicates-before-train-test-split
- [M] When should you remove duplicate training samples? When shouldn’t you?
- Missing data
- [H] In your dataset, two out of 20 variables have more than 30% missing values. What would you do?
- 2/20 x 100 = 10%
Context:
Types of missing values
- Missing Completely at Random (MCAR)
- Probability of data missing is the same for all observations. Missing values are independent of other data and there’s no pattern. e.g Due to sample loss, human err e.t.c
- This does not bias the analysis
- Missing at Random (MAR)
- There’s some relationship between the missing values and other variables in the data
- There’s some pattern in the missing values. The pobability of a value missing depends only on the observed data
- e.g “Age” may be missing for “Gender“=Female because females were reluctant to provide their age
- To get unbiased estimate, model the missing data
- Missing not at random (MNAR)
- There’s some structure in the missing data that the observed data cannot explain
- The missing values do not fall under MAR or MCAR
- It may happen due to group being unwilling to share info. e.g Low income earners leaving the income variable blank, but there’s no other variable in the data that can identify the group as (or relates to) low-income earners
- This will bias the model against missing values
Handling missing values
- Delete: If the values are MCAR or (sometimes) MAR.
- Impute: If MNAR
- Deleting
- If a few rows have many missing values, we can delete the entire row. If they are many, we can end up deleting the entire dataset
-
If some columns have many missing values, we can drop the entire column.
In our case, the 2 columns(variables) have only 30% missing values, so dropping them may remove important features from the rest of the data
- Imputing the missing values
- This estimation can be done by:
- Filling with mean/median of the rest of the data for continuous variables e.g Income
- Filling with mode for categorical variables. e.g Gender
- Using the previous or next value for time-series data
- Predict the missing values.
- Prediction can be done by building a model with the non-missing features and predicting the missing value of a row with the features it has.
- Regression model = continous variable and classifier for missing categorical variables
- We can also build a KNN and estimate the nearest neighbours for the missing values, then get the mean/median or mode as an estimate
- We need to select which features make most sense in predicting the missing variables and use them in training the model. e.g High-income earners are likely to travel in an expensive class. So this can be used to predict missing travel classes or fare
Back to the question.. What would you do?
- Select features that the missing values are most likely to depend on
- Build a predictive model using the 90% of rows having all variables present and estimate the 30% missing values
- Each of the 2 missing variables (columns) may need its own model if the the 2 are unrelated
- Regression and KNN (mean/median) will work for continous variables. Logistic regression and KNN(mode) will work for categorical values
- This estimation can be done by:
-
[M] How might techniques that handle missing data make selection bias worse? How do you handle this bias?
Selection bias: Bias introduced during selection of samples such that the data is not randomised, and the sample group is not representative of the entire population
- Techniques handling missing data might make the bias worse if the wrong technique is used on missing data.
- For example, dropping missing data that shows a pattern with the rest of the observed data points
- It can also arise while imputing missing values with a model when we select or fail to select features that the missing values really depend on
- The bias can be handled by ensuring that (1) the type of missing data is understood — is it independent or dependent on other observed data points? (2) the variables the missing data depends on are identified
- [H] In your dataset, two out of 20 variables have more than 30% missing values. What would you do?
-
[M] Why is randomization important when designing experiments (experimental design)?
-
It minimises selection bias, ensures each point has equal chance of being selected thus having samples representative of the whole population
-
- Class Imbalance
- [E] How would class imbalance affect your model?
- The model will be biased towards the majority class. It will assign higher prediction weight to the majority class group to its high prior probability. As a result, the instances belonging to the minority group will often be misclassified
- [E] Why is it hard for ML models to perform well on data with class imbalance?
- The model overfits to the majority class at it can get low prediction error by predicting every input to be of the majority class
-
[M] Imagine you want to build a model to detect skin legions from images. In your training dataset, only 1% of your images shows signs of legions. After training, your model seems to make a lot more false negatives than false positives. What are some of the techniques you’d use to improve your model?
- Get more training data.
- If the positive to negative class ratio is fixed, this will give more negative samples
- Generate sythentic minority samples
- Synthetic Minority Oversampling Technique(SMOTE) can be used to create samples from features of the minorty class.
- The drawback would be some non-linearity in the features will not be maintained
- Sample out the majority class
- This will give balance between the two classes
- Treat the minority classes as outliers and train an anomaly detector
- Penalise the model more for making prediction errors on the minority class
- Adds weight to the minority class
- Choice of algorithm
- Decision trees tend to perform well on imbalanced datasets
Ref:
https://www.quora.com/Why-are-imbalanced-classes-a-problem-in-machine-learning
- Get more training data.
- [E] How would class imbalance affect your model?